

What this ranking compares
This report compares surface heat in 18 cities. It does not name the hottest place on Earth. It does not predict heat deaths. The cities have more than two million inhabitants and sit between 18° and 42° north. All of them are measured in April and May 2026.
The IVC combines four measures, each with equal weight:
- LST (land surface temperature), peak: urban fraction whose per-pixel maximum exceeds 43 °C.
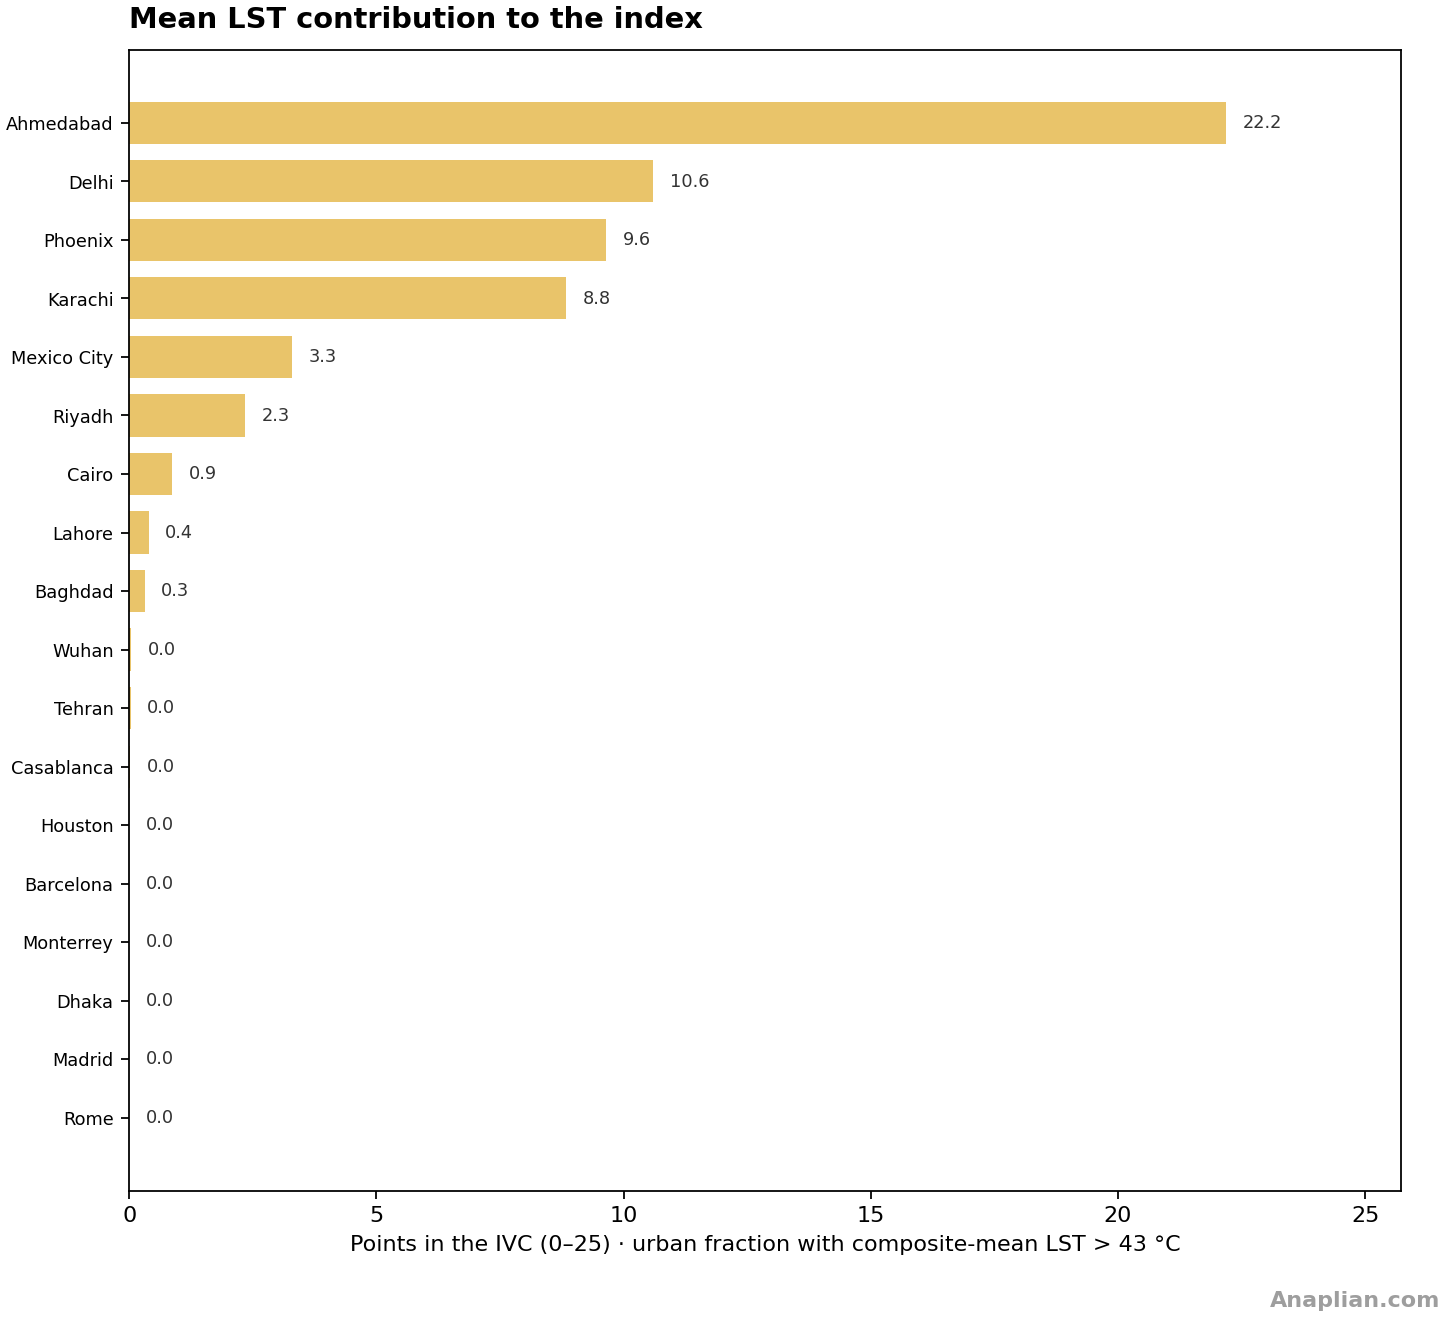
- LST mean: urban fraction whose composite mean exceeds 43 °C.
- NDVI (normalized difference vegetation index), inverted: less greenness raises the index.
- SUHI (surface urban heat island): urban mean LST minus that city’s rural temperature. A negative SUHI adds nothing.
The urban mask and the rural reference come from GHSL (Global Human Settlement Layer) and its SMOD (settlement model).
We chose them for hazard, exposure and vulnerability — not for temperature records. That is why an index of 60 in Ahmedabad can be read next to a 60 in Iztapalapa.
One list, one window
City reports already exist one by one. Here they share a single list, using each city’s official polygon, so the rank can be read next to the district or borough reports.
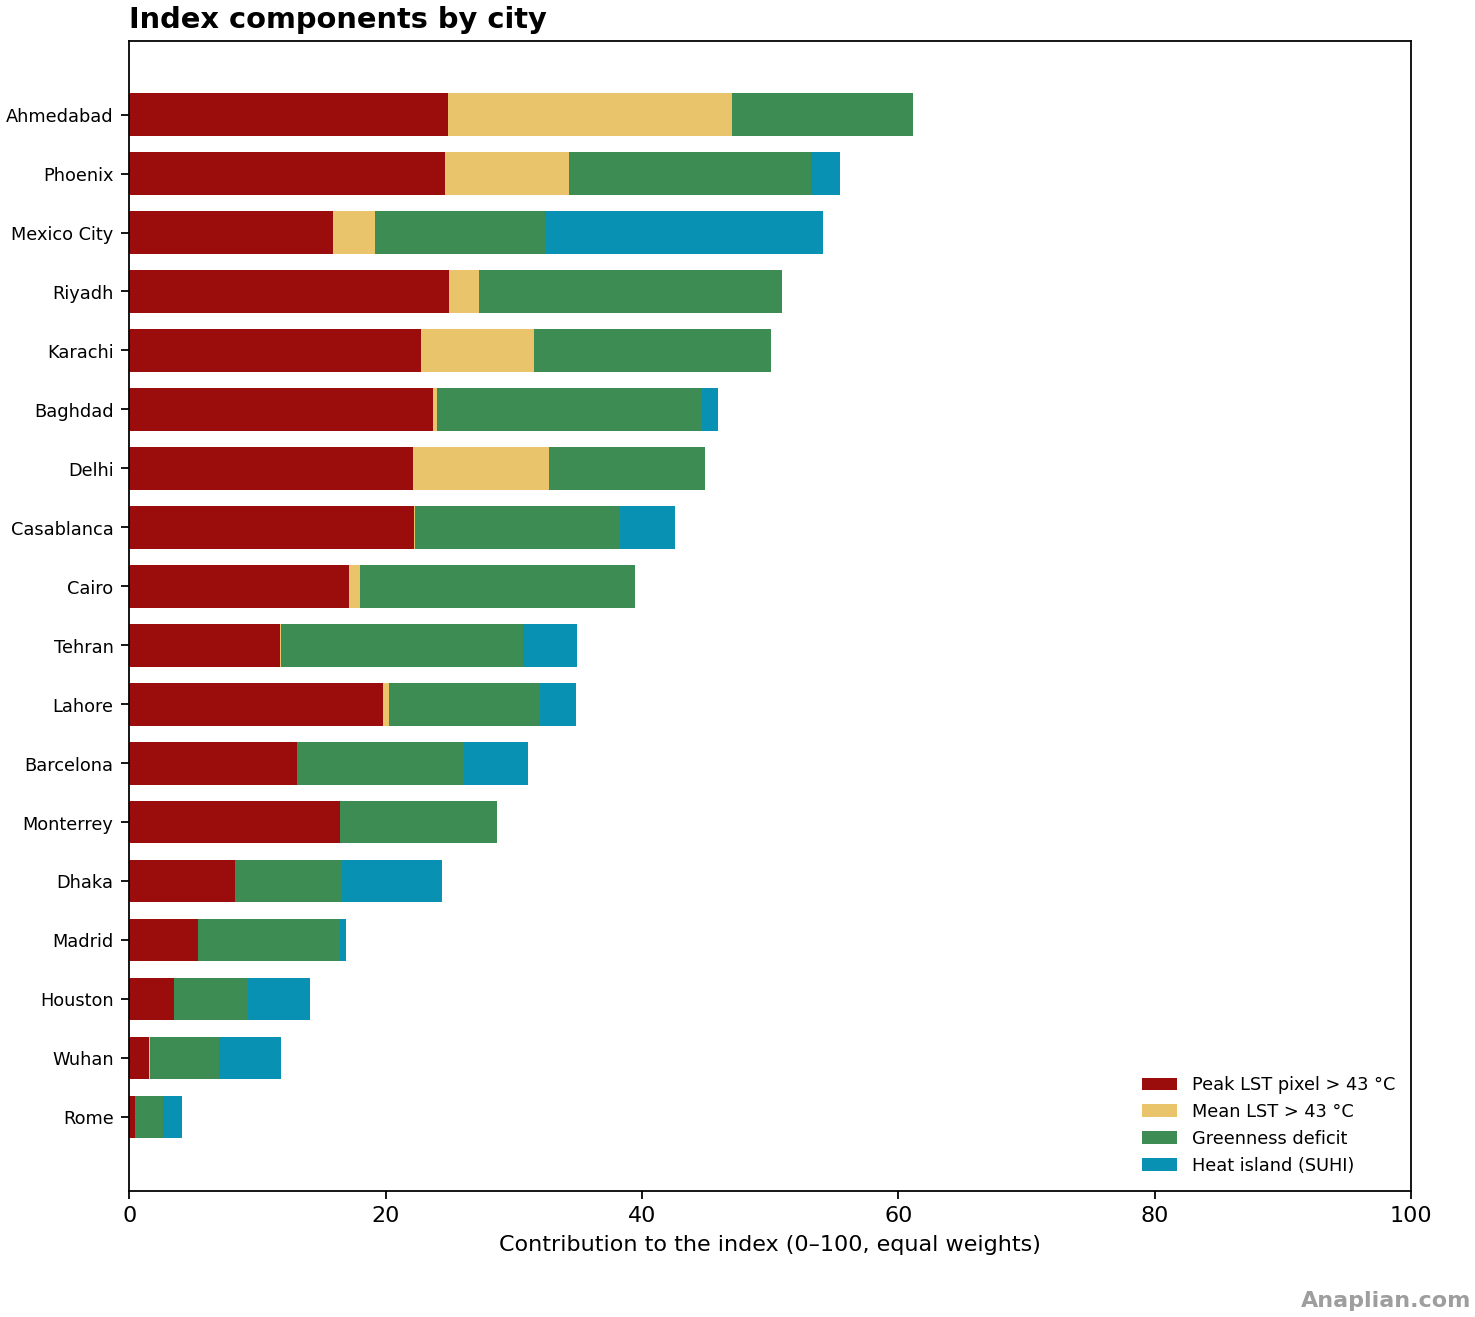
Headline result. Ahmedabad leads (61.1/100). Rome is last (4.1/100). City median 37.2. 6 cities have urban SUHI below 0 °C.
City ranking




| # | City | P | IVC | Peak > 43 °C | Mean > 43 °C | SUHI °C | T rural | NDVI | Units |
|---|---|---|---|---|---|---|---|---|---|
| 1 | Ahmedabad | 2 | 61.1 | 99% | 89% | -1.7 | 48.1 | 0.27 | 7 |
| 2 | Phoenix | 2 | 55.4 | 99% | 39% | +1.3 | 40.3 | 0.17 | 15 |
| 3 | Mexico City | 1 | 54.1 | 64% | 13% | +13.0 | 25.6 | 0.28 | 16 |
| 4 | Riyadh | 3 | 50.9 | 100% | 9% | -0.0 | 39.9 | 0.08 | 14 |
| 5 | Karachi | 1 | 50.1 | 91% | 35% | -3.2 | 44.1 | 0.18 | 24 |
| 6 | Baghdad | 1 | 46.0 | 95% | 1% | +0.8 | 37.6 | 0.14 | 4 |
| 7 | Delhi | 1 | 44.9 | 89% | 42% | -2.5 | 45.1 | 0.31 | 11 |
| 8 | Casablanca | 3 | 42.6 | 89% | 0% | +2.6 | 27.1 | 0.23 | 16 |
| 9 | Cairo | 1 | 39.5 | 69% | 3% | -0.6 | 39.0 | 0.12 | 41 |
| 10 | Tehran | 2 | 35.0 | 47% | 0% | +2.6 | 30.2 | 0.17 | 22 |
| 11 | Lahore | 2 | 34.9 | 79% | 2% | +1.7 | 36.6 | 0.31 | 2 |
| 12 | Barcelona | 3 | 31.1 | 52% | 0% | +3.0 | 26.3 | 0.29 | 10 |
| 13 | Monterrey | 2 | 28.7 | 66% | 0% | -0.5 | 27.8 | 0.31 | 13 |
| 14 | Dhaka | 2 | 24.4 | 33% | 0% | +4.7 | 26.8 | 0.38 | 41 |
| 15 | Madrid | 1 | 16.9 | 22% | 0% | +0.3 | 22.8 | 0.33 | 21 |
| 16 | Houston | 3 | 14.1 | 14% | 0% | +2.9 | 23.8 | 0.44 | 11 |
| 17 | Wuhan | 3 | 11.8 | 6% | 0% | +2.9 | 24.4 | 0.44 | 13 |
| 18 | Rome | 3 | 4.1 | 2% | 0% | +0.9 | 26.4 | 0.51 | 15 |
Patterns
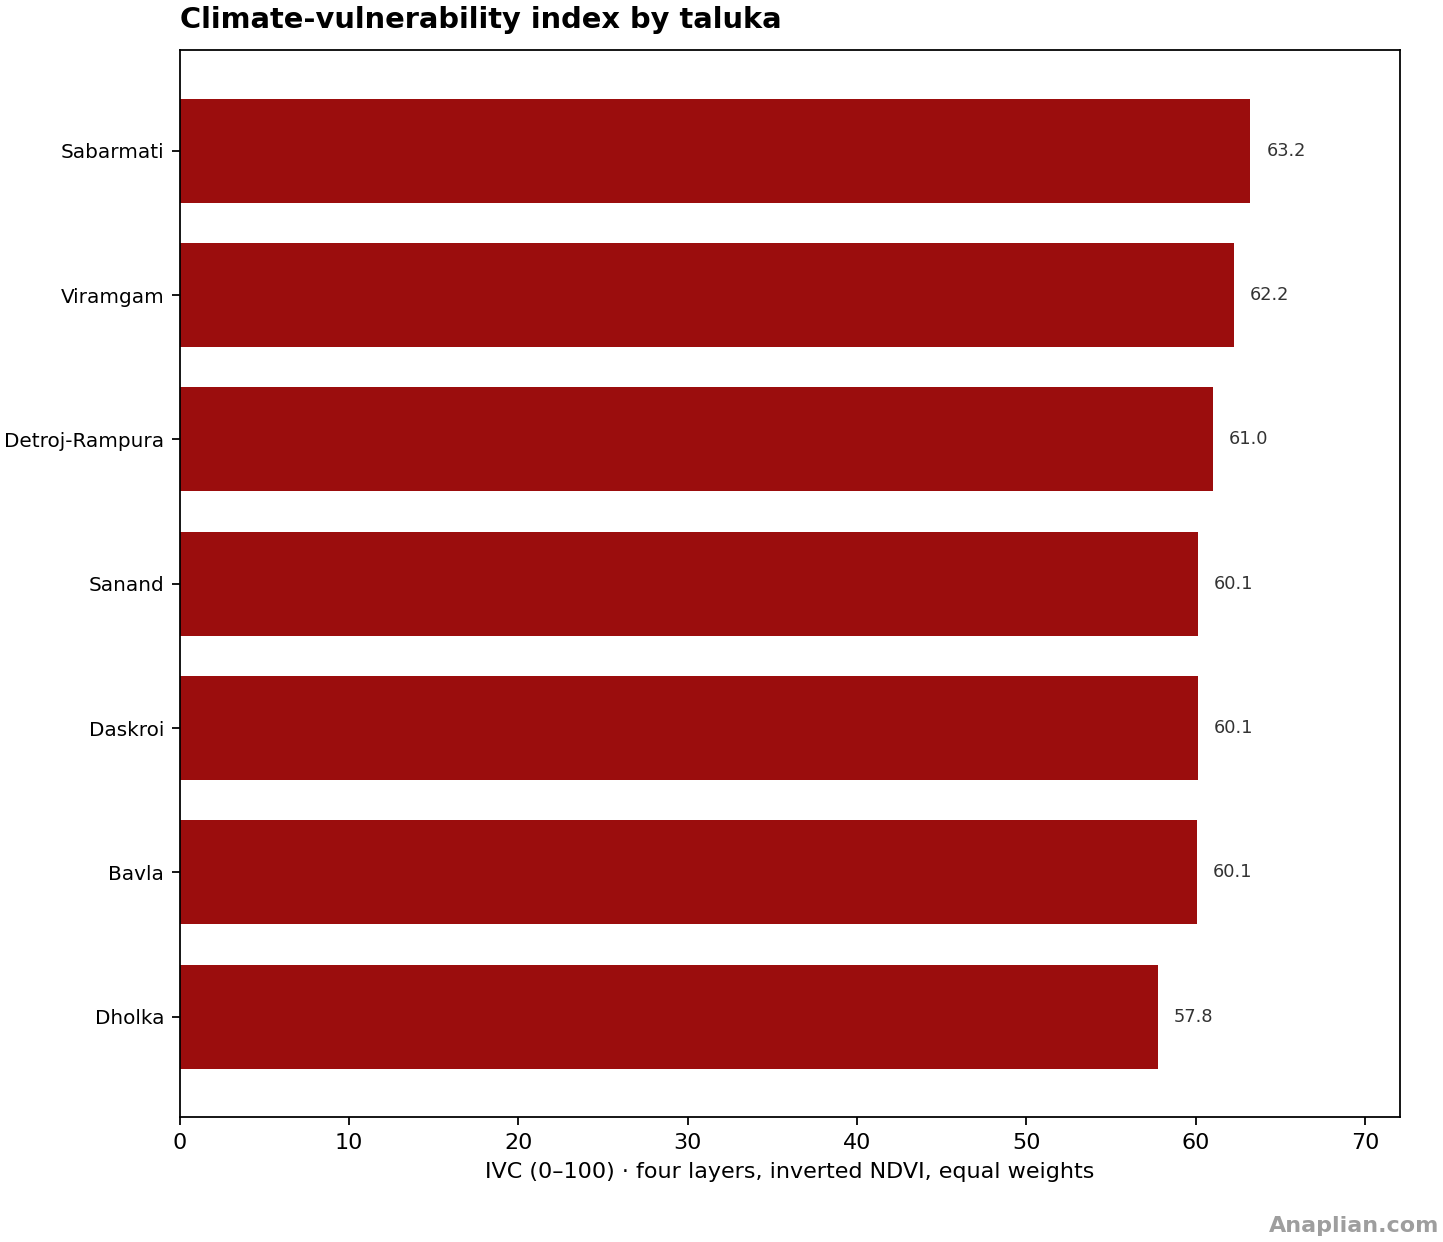
Ahmedabad leads (61.1/100) because almost all of its urban fabric exceeds 43 °C at both the pixel maximum (~99%) and the composite mean (~89%). The GHSL rural reference is itself a furnace (48 °C), so SUHI is negative (-1.7 °C) and adds zero to the index. Ahmedabad ranks high on three layers, not on a classic city-versus-countryside island. Inside the city the ranking is almost flat (about 58–63): every taluka (subdistrict) is already a furnace. The 2013 Heat Action Plan is a public-health pioneer; the IVC measures remaining surface exposure, not lives the plan saves.
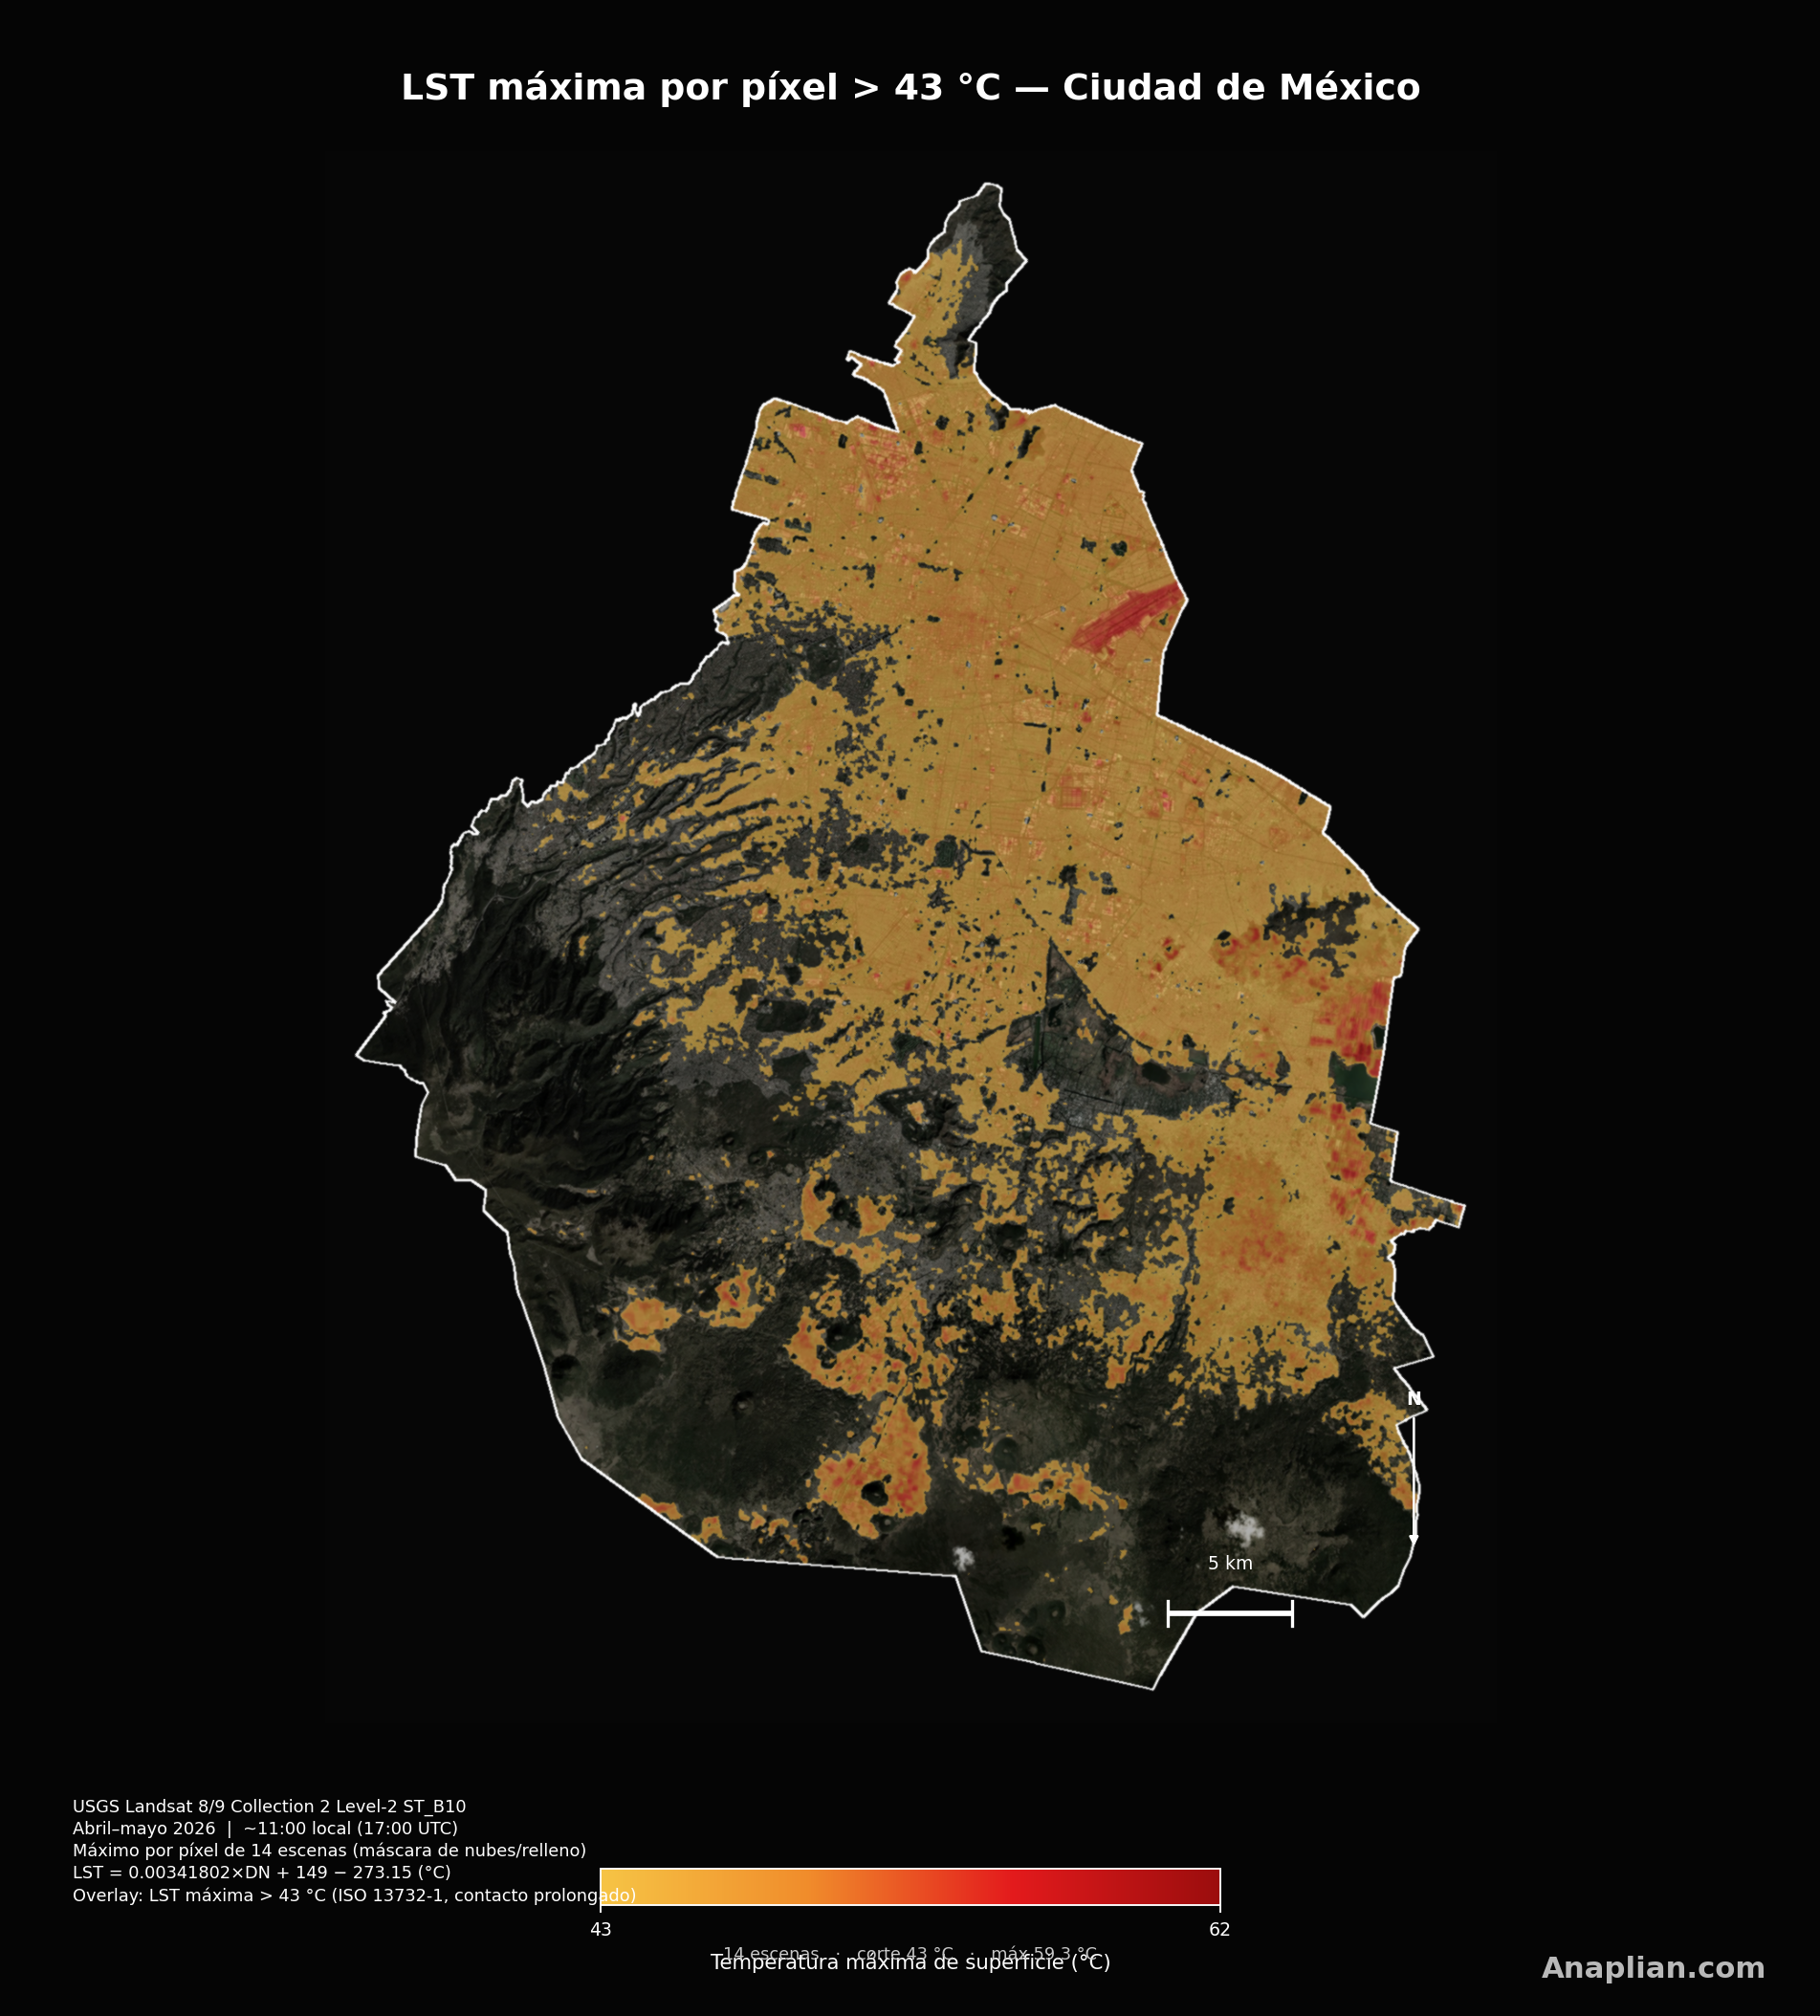
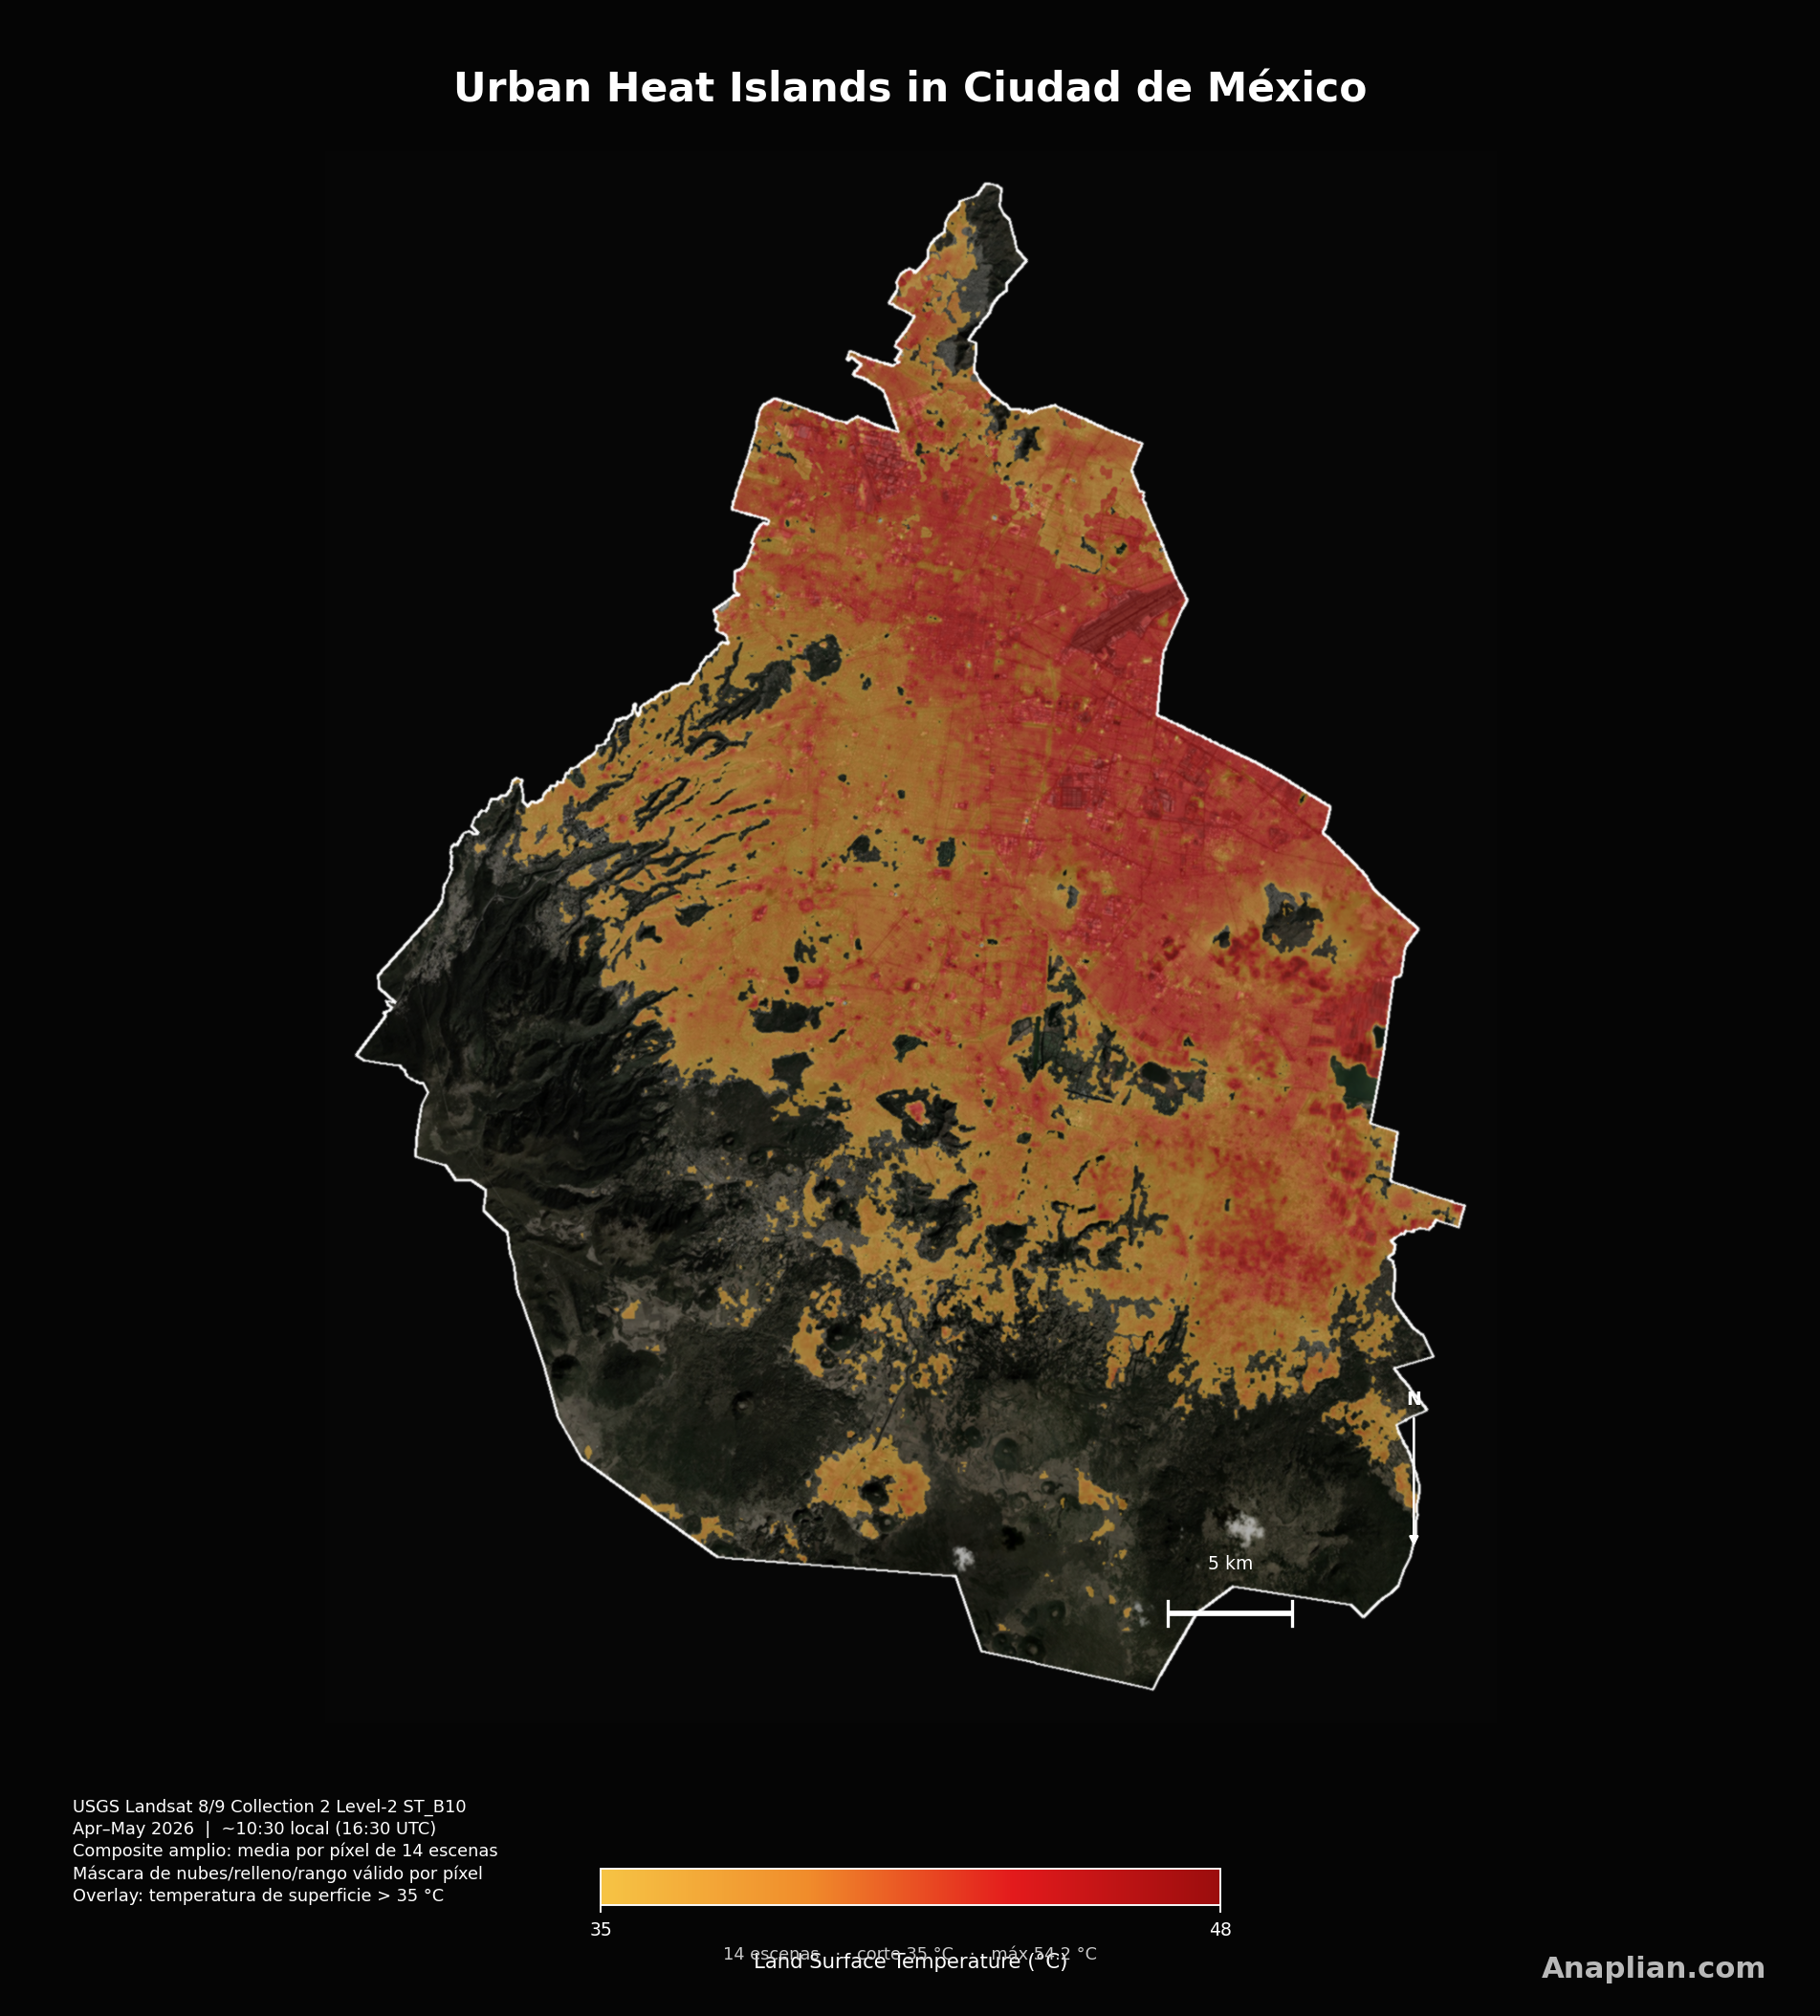
Mexico City is not first on the IVC (54.1/100, third), but it has the strongest heat island in the sample (SUHI +13.0 °C). Southern conservation land sits near 26 °C while the paved east exceeds 43 °C. That is the harshest urban heat wave in this set: not the hottest desert, but the city that warms the most relative to its own surroundings. 6 cities have SUHI below 0 °C; that component is clipped at zero.
Rome (4.1) and Madrid (16.9) sit at the bottom because April–May is spring, not their annual peak. Houston and Wuhan enter on the same fixed window. The scale is kept so that a 60 in a Houston district remains comparable to Iztapalapa.
Casablanca sits between Cairo and Barcelona: same latitude as Phoenix, Atlantic softening, less adaptive capacity than Europe. Lahore is close to Tehran at city scale; two tehsils (subdistricts) hide the intra-city range that 41 qisms (district sections) in Cairo or 16 alcaldías (boroughs) in Mexico City show. Grain is not population-weighted.
Ahmedabad — first on the index
Ahmedabad leads at 61.1/100. About 99% of the urban area exceeds 43 °C at the pixel peak and 89% at the two-month mean. Peak LST therefore contributes 24.9 points to the index and mean LST 22.2 points (each layer caps at 25). Rural GHSL land is 48 °C, so SUHI is -1.7 °C and adds zero. The ranking inside the city is almost flat (58–63 across 7 talukas / subdistricts). Sabarmati is highest; Dholka is lowest. The 2013 Heat Action Plan is a public-health pioneer; the IVC measures remaining surface exposure, not lives the plan saves.


Phoenix — second
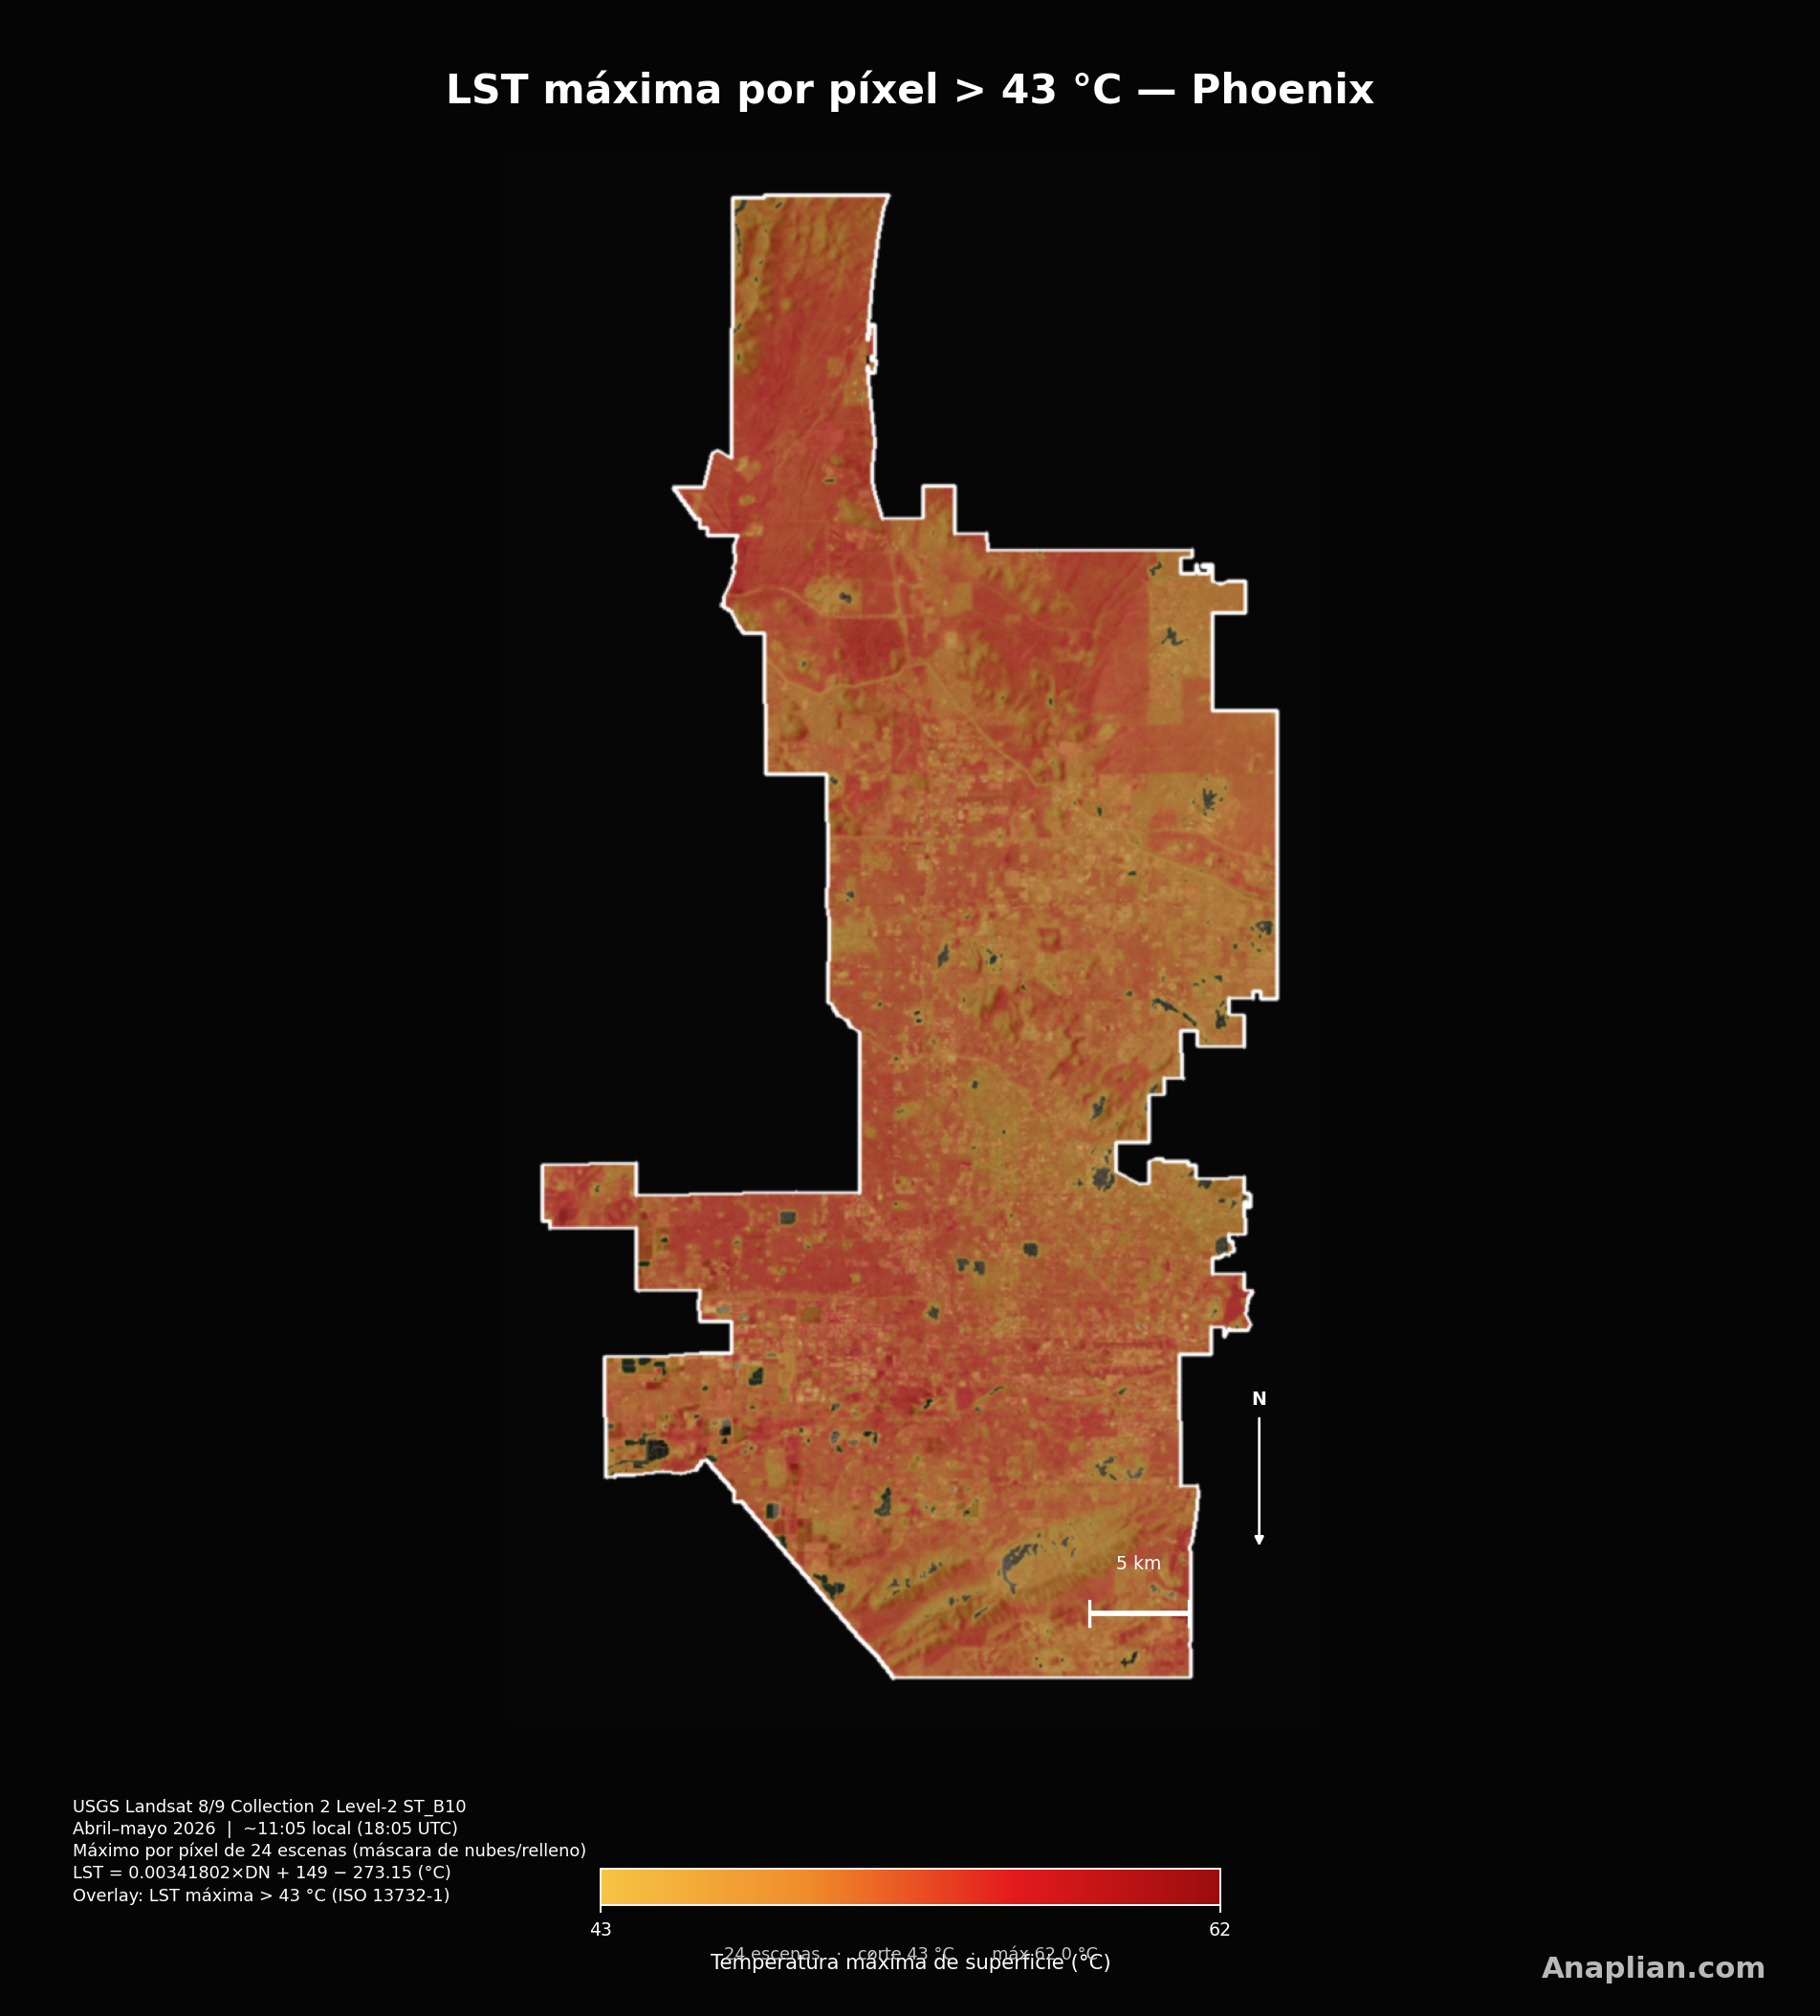
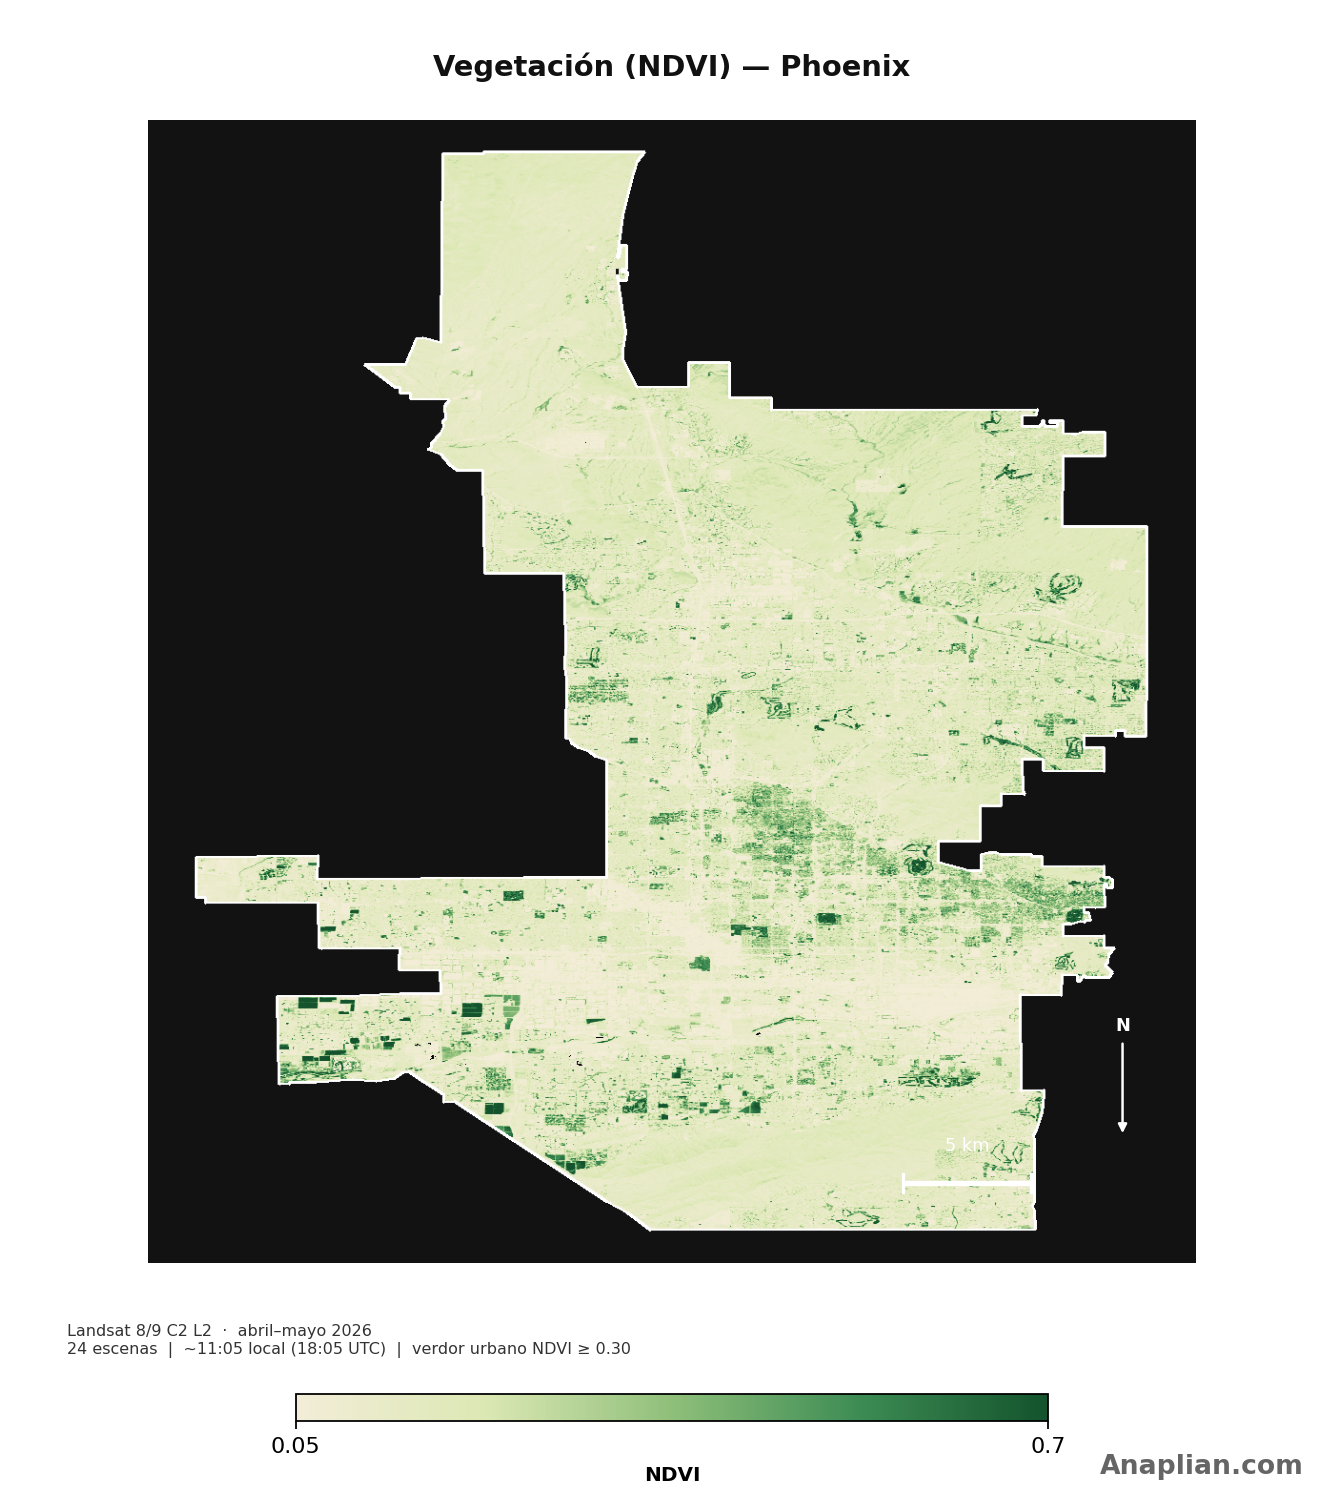
Phoenix is second (55.4/100). Peak LST is almost saturated (99% above 43 °C, 24.7 points), but the mean layer is much weaker (39%, 9.6 points): April–May is not Phoenix’s July peak. SUHI is only +1.3 °C against a 40 °C rural desert. Greenness is low (NDVI 0.17). Maryvale leads the urban villages at 71.2; Desert View is last at 43.6.



Mexico City — third, strongest heat island
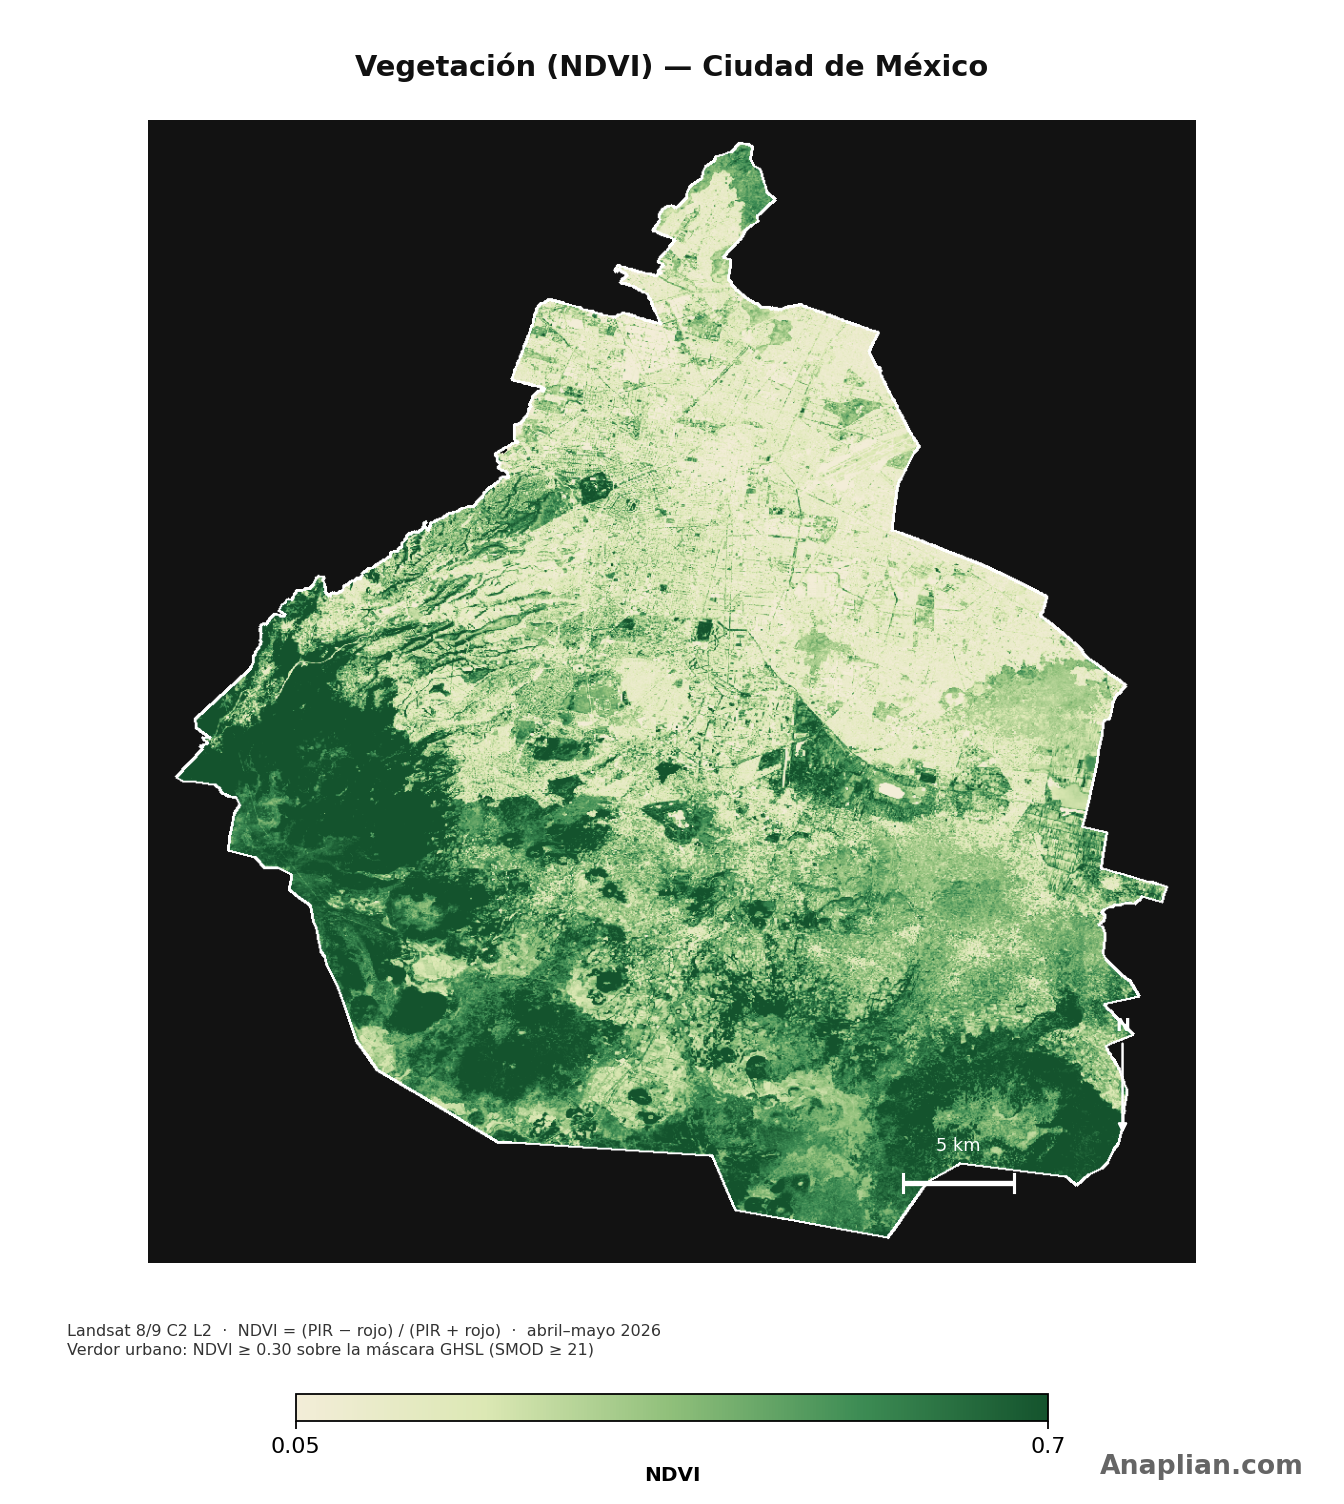
Mexico City is third (54.1/100) but has the sample’s strongest SUHI (+13.0 °C). Peak LST covers 64% of the urban area (15.9 points); mean LST only 13% (3.3 points). The heat-island layer adds 21.7 points — almost the whole 25-point cap — because southern conservation land is near 26 °C while the paved east exceeds 43 °C. Intra-city range is the widest in the sample (11.3–82.6). Venustiano Carranza leads; Cuajimalpa de Morelos is last.

Rome — lowest score
Rome is last (4.1/100). April–May is spring, not the Mediterranean summer peak. Only 2% of the urban area exceeds 43 °C at the pixel maximum and 0% at the mean, so the two LST layers add 0.4 and 0.0 points. NDVI is high (0.51) and SUHI is modest (+0.9 °C). Municipio V is the warmest municipio (municipality) at 12.9; Municipio XIV is 0.0. The low city score is the fixed window working as designed: a 60 here would still be comparable to Iztapalapa.


Karachi — what a negative SUHI means
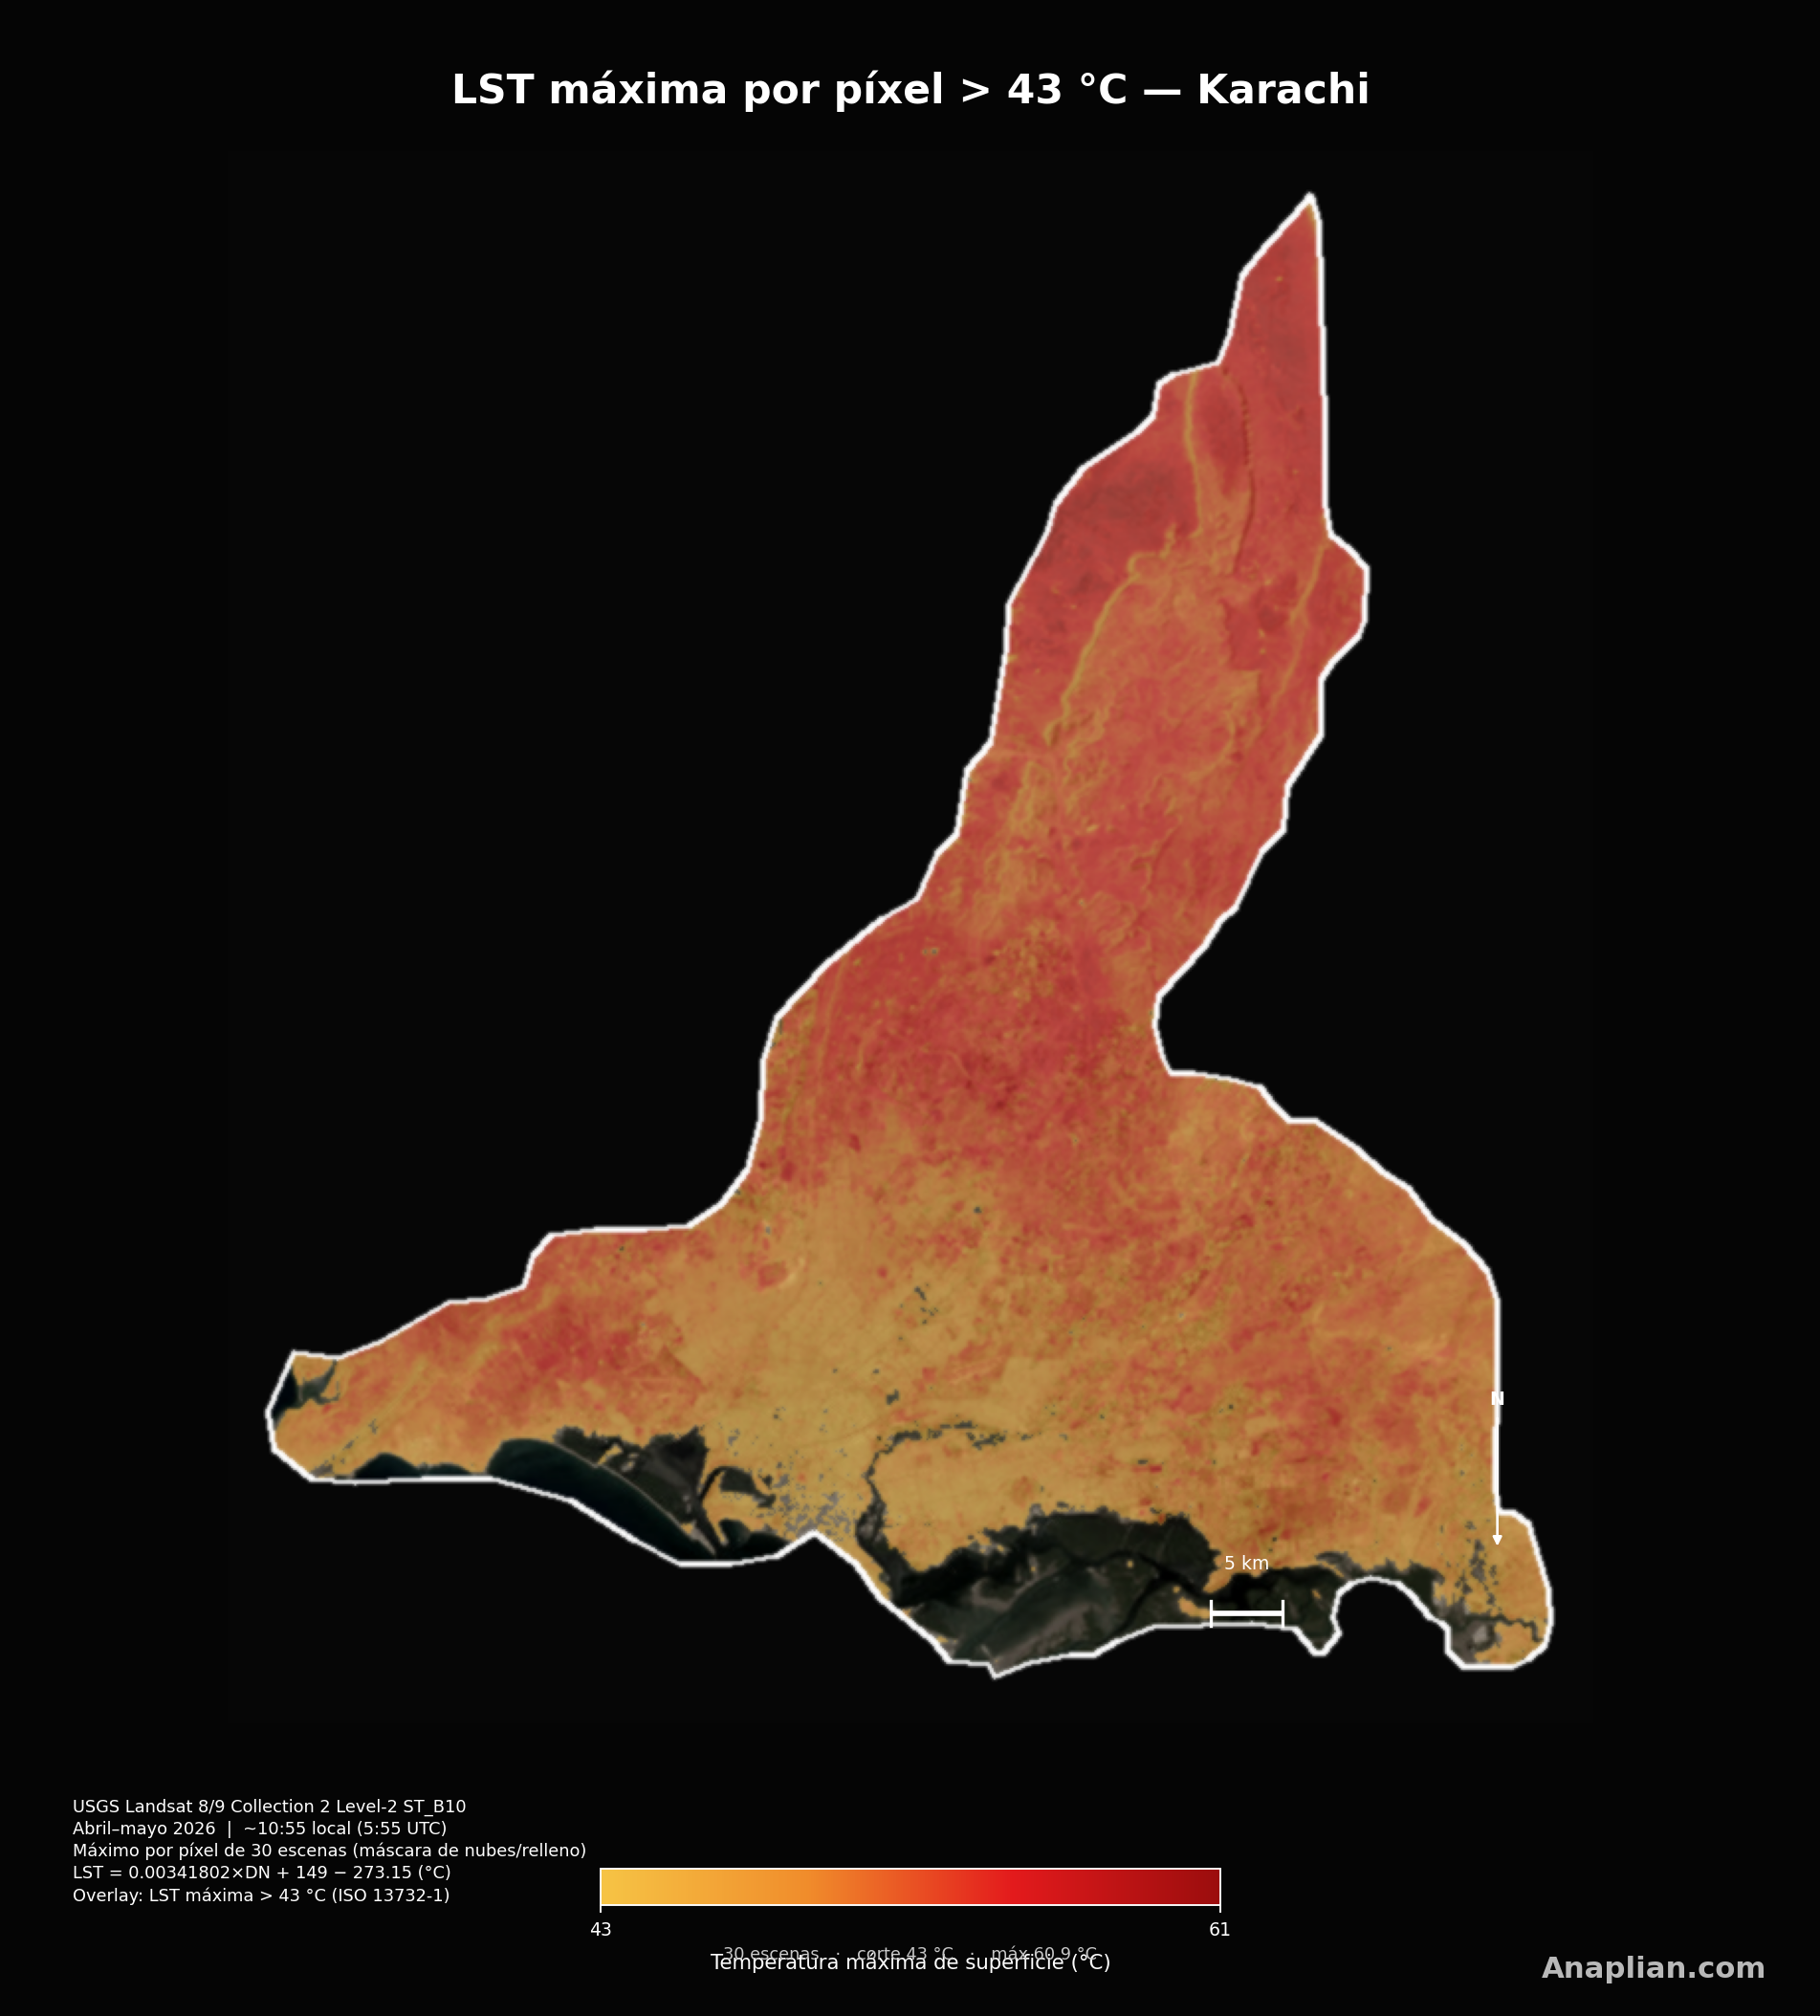
Karachi ranks fifth (50.1/100) with SUHI -3.2 °C. That does not mean the city is cool. Rural GHSL land around Karachi averages 44 °C — hotter than the urban mean — so the “island” is inverted: the city is a relative oasis next to an arid belt, while 91% of the urban fabric still exceeds 43 °C at peak (22.7 points) and 35% at the mean (8.8 points). The SUHI component is clipped at zero, so a negative value neither raises nor lowers the IVC: Karachi is not rewarded for being cooler than a furnace, and it is not treated as an island city. NDVI is low ({k['ndvi']:.2f}), so greenness deficit still adds 18.5 points. New Karachi Town leads at 59.3; Manora Cantonment (coastal) is last at 17.0. Six cities in this sample have SUHI below 0 °C for the same reason: the rural reference is itself extreme heat.


Methodology
1. Peak LST
Landsat 8 and 9, Collection 2 Level 2, thermal band 10, 1 April–31 May 2026. Fill, cloud and shadow pixels are dropped, as are temperatures outside 0–80 °C. The peak component is the urban fraction (GHSL SMOD ≥ 21) whose per-pixel maximum LST exceeds 43 °C, the ISO 13732-1 prolonged-contact limit.
2. Mean LST of the observations
Mean of the valid scenes in the same window. The mean component is the urban fraction whose composite-mean LST exceeds 43 °C. The map colour starts at 35 °C; the index still uses 43 °C.
3. NDVI
NDVI uses Landsat near-infrared and red reflectance. The greenness-deficit component inverts urban NDVI on a fixed 0.05–0.55 scale: less vegetation raises the index. The scale is not stretched to each city’s own min and max.
4. SUHI
SUHI is urban mean LST minus rural temperature. Rural land is GHSL SMOD 11–13, excluding water; if internal rural land is under 80 km², a 20 km GHSL belt is used. A negative SUHI adds nothing: a city is not rewarded for sitting in a hotter desert.
Land surface temperature. LST (°C) = 0.00341802 × DN + 149 − 273.15
DN is the Landsat Collection 2 Level-2 digital number of band 10 (ST_B10).
Peak component. zmax = urban fraction with LSTmax > 43 °C
Urban mask: GHSL 2020 SMOD ≥ 21. Threshold: ISO 13732-1 prolonged contact.
Mean component. zmean = urban fraction with LSTmean > 43 °C
Normalized difference vegetation index. NDVI = (NIR − red) / (NIR + red)
Greenness-deficit component. zNDVI inv = 1 − clip((NDVI − 0.05) / (0.55 − 0.05), 0, 1)
NIR and red are Landsat SR_B5 and SR_B4. clip(x, 0, 1) = min(max(x, 0), 1).
Surface urban heat island. SUHI (°C) = LSTmean, urban − Trural
Rural T is the GHSL SMOD 11–13 mean, excluding water. If internal rural land is under 80 km², a 20 km GHSL belt is used.
Heat-island component. zSUHI = clip(max(SUHI, 0) / 15, 0, 1)
Climate-vulnerability index. IVC = 100 × (zmax + zmean + zNDVI inv + zSUHI) / 4
Equal weights. Caps are fixed, so an IVC of 60 is comparable across cities.
Limits
The index does not include population, age, informal work or access to cooling. Unit grain differs (2 tehsils / subdistricts in Lahore, 41 qisms / district sections in Cairo). Rural T is GHSL, not a weather station. Landsat overpass is late morning. April–May 2026 is a common window, not each city’s worst month.
Annotated bibliography
- IPCC, Sixth Assessment Report, Working Group II (2022). — Frames climate risk as hazard × exposure × vulnerability. The city sample follows that product, not a hottest-place list.
- WHO / WMO, Heatwaves and Health (2015, updates). — There is no universal air-temperature threshold for mortality. Heat-health guidance is relative to the local climate; our 43 °C cut is a contact standard, not a death threshold.
- Kariyawasam et al., Sustainable Cities and Society / Oxford Smith School (2026). — Ranking of 205 cities over one million people. More than 95% of the worst-ranked lie in South/Southeast Asia and Africa; Basra, next to Baghdad, is first. Justifies including Karachi, Delhi, Cairo and Baghdad.
- Turner, Higgs, Sun et al., GUHVI, Urban Climate 64:102716 (2025). — Global urban heat-vulnerability index. Combines heat exposure, sensitivity and adaptive capability at neighbourhood scale; used here as a sampling frame, not as the Landsat score.
- Tuholske et al., PNAS (2021). — Urban person-days with wet-bulb globe temperature above 30 °C tripled from 1983 to 2016. Growth is concentrated in South Asian cities in this sample (Lahore, Dhaka, Ahmedabad).
- Mora et al., Nature Climate Change (2017). — Deadly heat conditions could become annual at +2 °C. Cited for Karachi’s humid-coastal regime after the 2015 heatwave.
- Gasparrini et al., The Lancet (2015). — In temperate cities, mortality rises faster per extra degree because the population is less acclimatised. Why Madrid, Barcelona and Rome stay in the sample even though April–May is spring.
- ISO 13732-1:2006. — Ergonomics of the thermal environment — skin contact. 43 °C is the prolonged-contact limit used as the Landsat overlay and as z_max / z_mean.
- Chakraborty et al. (2025), “Satellite-derived land surface temperatures strongly mischaracterise urban heat hazard.” — LST maps materials and shade; it does not replace air, humidity or wind for mortality. The IVC is a surface-exposure score.
- European Commission, GHSL SMOD V2-0, 2020 epoch. — Urban mask (SMOD ≥ 21) and rural reference (SMOD 11–13, no water). The 20 km belt is used when internal rural land is under 80 km².
- USGS / NASA, Landsat 8 and 9 Collection 2 Level 2. — ST_B10 surface temperature and SR_B4/B5 reflectance, 1 April–31 May 2026, fill/cloud/shadow mask.
- Knowlton et al. / NRDC–IITM, Ahmedabad Heat Action Plan (2013–). — Pioneer South Asian heat plan. The IVC still ranks Ahmedabad first because it measures remaining surface exposure, not the plan’s lives saved.